Tail of the Jones Polynomial Heatmaps
Visualizations of the tail of the colored Jones polynomials and colored \(\mathfrak{sl}_N\) polynomials.
- x axis: even q powers
- y axis: jth colored Jones polynomial normalized by the lowest q power and so that the constant term is positive.
- heatmap: coefficient of monomials, where orange is +1, green is -1, red is > 1, and blue is < 1
Note that because of this color scheme, the color bar is often a bit buggy. Additionally, we plot a staircase that shows the highest stable q power for each polynomial.
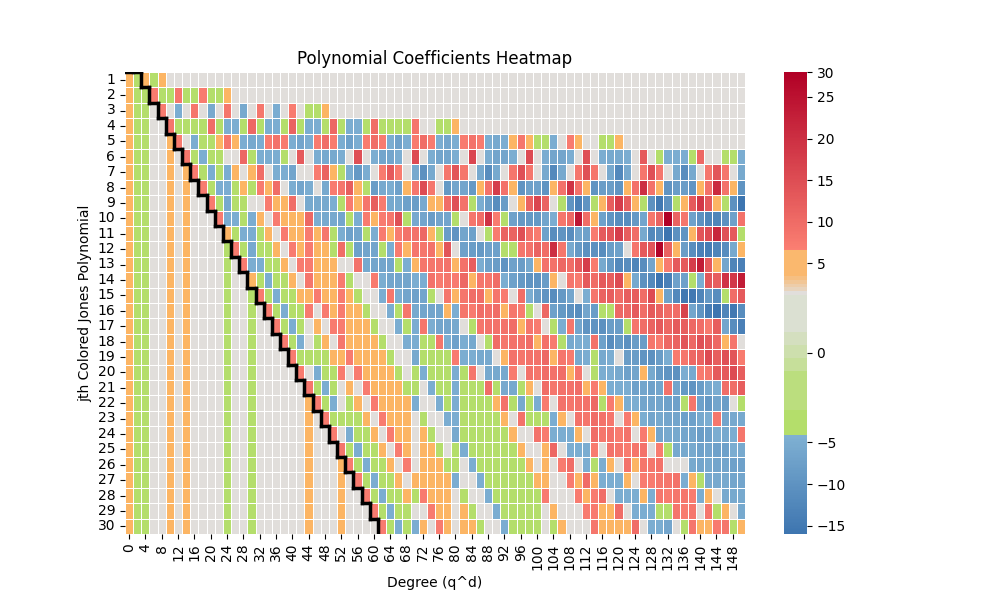
Tail of Jones polynomial for \(K_{5/2}\).
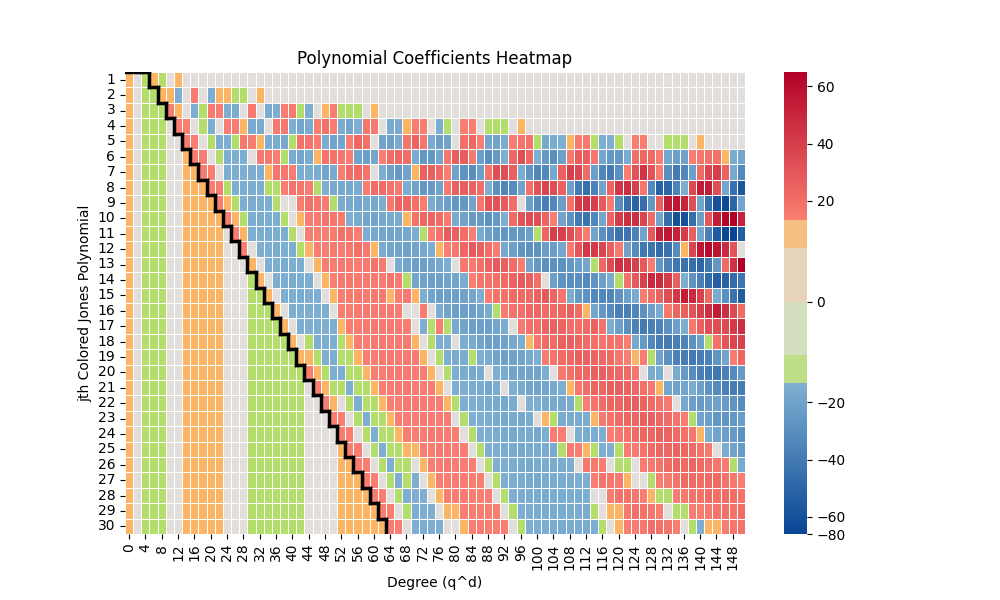
Tail of \(\mathfrak{sl}_3\) polynomial for \(K_{5/2}\).
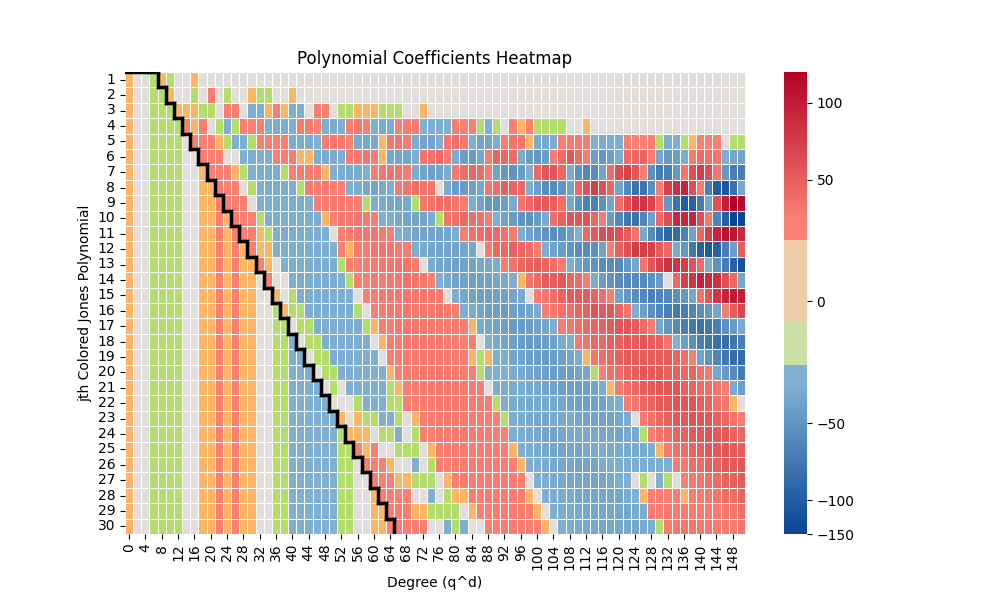
Tail of \(\mathfrak{sl}_4\) polynomial for \(K_{5/2}\).
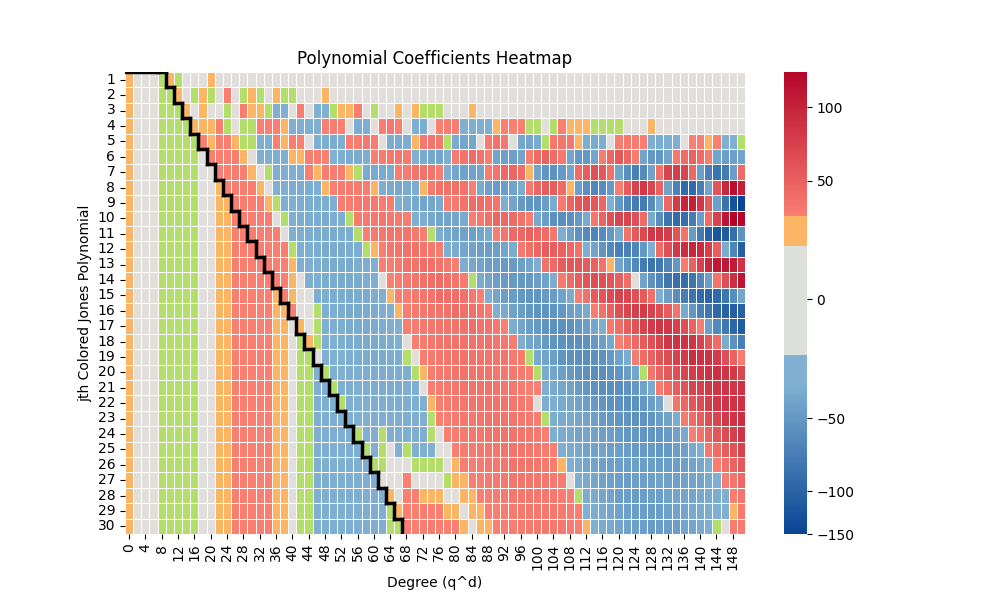
Tail of \(\mathfrak{sl}_5\) polynomial for \(K_{5/2}\).
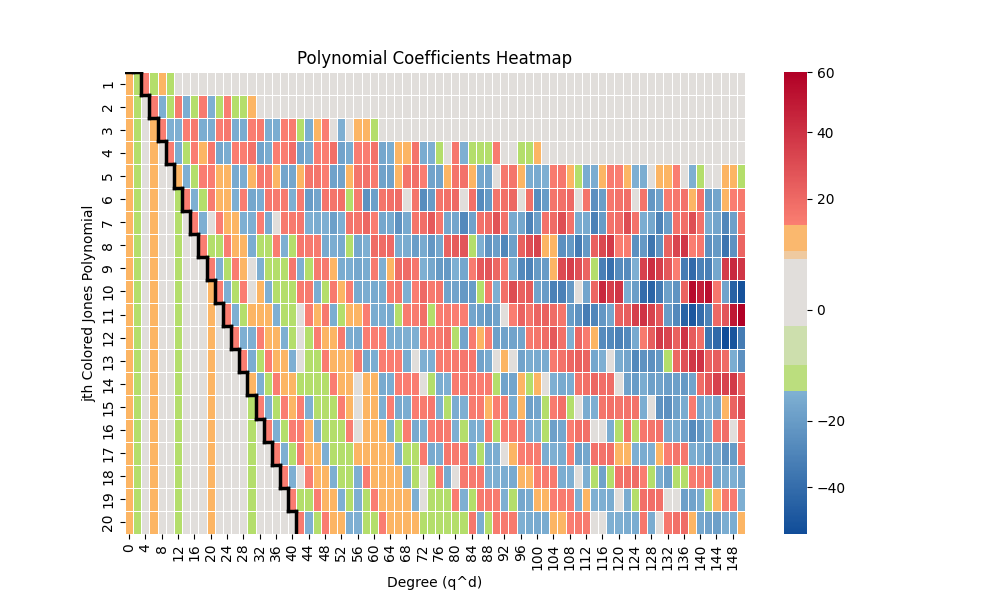
Tail of Jones polynomial for \(K_{7/3}\).
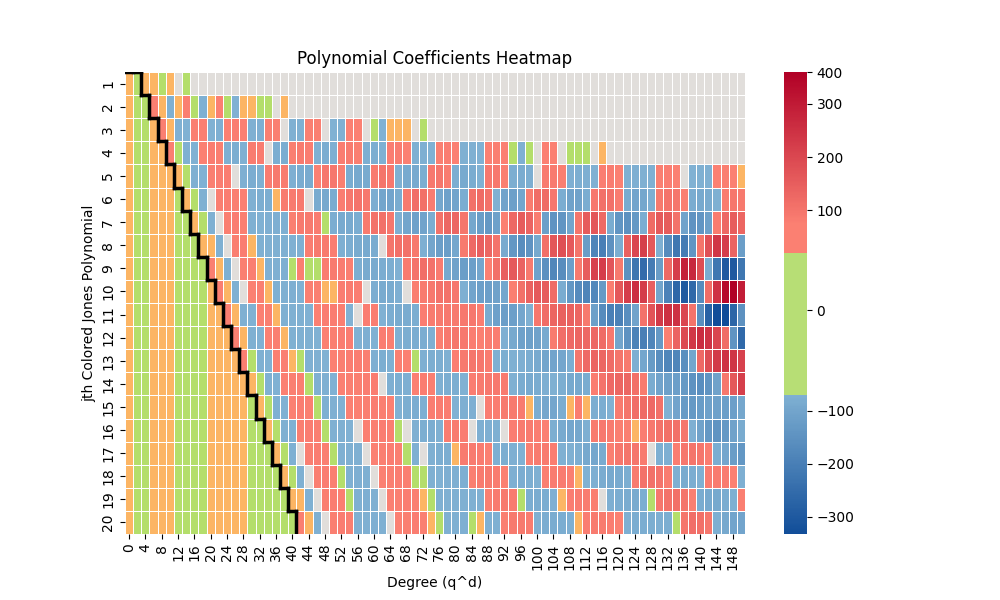
Tail of \(\mathfrak{sl}_3\) polynomial for \(K_{7/3}\).
Tail of \(\mathfrak{sl}_4\) polynomial for \(K_{7/3}\).
Tail of \(\mathfrak{sl}_5\) polynomial for \(K_{7/3}\).